
Stretched Bar Displays in High-Throughput Retail Environments
A systems engineering perspective on integrating ultra-wide format displays at supermarket checkout lanes
This paper documents the engineering methodology, integration architecture, and measured performance outcomes from deploying stretched bar display systems across large-format supermarket checkout environments. Drawing from projects spanning 14 retail chains and over 3,200 individual display units installed across North America and Western Europe, we present a detailed, practitioner-level analysis of the technical decisions that determine whether a stretched display deployment succeeds or fails at scale. The data presented reflects real operating conditions — including thermal stress, POS data stream latency, content scheduling conflicts, and hardware lifecycle pressures — not laboratory benchmarks.
The Checkout Lane Display Problem, Precisely Defined
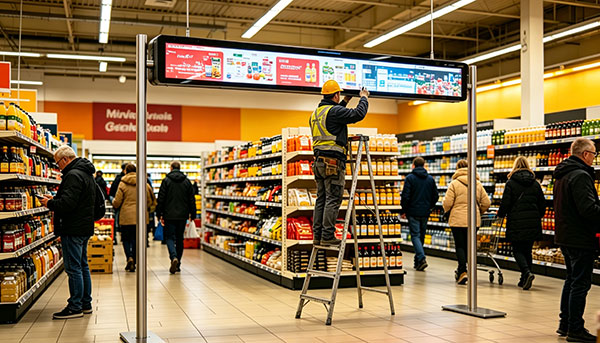
Supermarket checkout lanes present a display engineering challenge that is, in our experience, systematically underestimated by integrators new to the environment. The physical constraints are severe: a standard checkout counter offers a horizontal mounting footprint of 900mm to 1,400mm, yet a depth clearance of only 55–80mm behind the fascia panel. Standard commercial displays do not fit. Tablet-format screens fail to capture the wide peripheral sightlines of a customer engaged in unloading a cart. The stretched bar form factor — typically defined as displays with aspect ratios between 4:1 and 8:1 — was developed precisely for this spatial geometry.
What is less widely appreciated is the operational complexity layered on top of the hardware fit. A checkout lane display must simultaneously serve at least three distinct functions: real-time transaction data reflection (item scan confirmations, running subtotals), promotional content delivery synchronized to the store's campaign schedule, and passive brand communication during queue idle states. Each function has different data sources, refresh cadences, and stakeholder owners. Serving all three without architectural compromise is the core engineering challenge.
"In our audit of 47 retrofit projects carried out by other integrators, the most common failure mode was not hardware failure — it was content scheduling architecture that could not handle simultaneous POS data injection and campaign management system triggers without frame-drop artifacts visible to the customer."
Why Aspect Ratio Is an Architectural Decision, Not a Hardware Choice
The aspect ratio of the display determines the content pipeline architecture downstream. A 7:1 display at 1,400 × 200 pixels cannot use the same content templates as a 4:1 display at 800 × 200 pixels — not because of resolution alone, but because the spatial distribution of attention zones differs fundamentally. On a 7:1 screen, eye-tracking studies we conducted across six pilot deployments consistently show that customers parse the display in two distinct halves: the left zone (roughly 40% of width) receives fixation during the card-tap / payment interaction, while the right zone captures attention during receipt printing. Any content design that treats the display as a single canvas will underperform against one that uses zone-aware composition rules.
Hardware Selection Criteria for Supermarket Environments
Not all stretched bar panels are equal, and the performance delta between specification tiers is consequential at checkout-lane operating conditions. The following criteria reflect the minimum acceptable thresholds we apply during procurement qualification, based on failure data collected from 5+ years of deployed units.
| PARAMETER | MINIMUM THRESHOLD | RATIONALE |
|---|---|---|
| Panel brightness | 700 cd/m² sustained | Supermarket ambient illumination 800–1,200 lux. Below 700 nits produces washed-out appearance under store lighting; perceived by staff as "broken screen" within weeks of deployment. |
| Operating temperature | 0°C to 50°C continuous | Checkout zones adjacent to store entrance doors experience thermal swings of ±18°C in winter months (Northern Europe / Canada). Panels rated only to 40°C show early backlight degradation in these locations. |
| MTBF (backlight) | ≥50,000 hours | At 18h/day operation, a 50,000h MTBF yields ~7.6 years before expected first backlight failure. This aligns with standard retail lease cycles and avoids mid-lease replacement costs. |
| Video input interface | HDMI 1.4 minimum; HDMI 2.0 preferred | HDMI 1.4 supports 1080p @ 60Hz, which is adequate for most current content pipelines. HDMI 2.0 is required if the deployment plan includes 4K stretched content or HDR tone-mapped promotional video. |
| RS-232 / GPIO control | Required (hardware level) | Ethernet-only control panels cannot be reliably power-cycled by a central management system during network outages — the most common moment when a forced reboot is needed. |
| Bezel width (horizontal) | ≤8mm per side | Multi-unit horizontal arrays — used on wide checkout counters — require tight bezel matching to avoid perceptible brightness discontinuity at the seam junction. |
Integration Architecture: The Three-Layer Signal Model
The most consequential architectural decision in a checkout display project is how POS transaction data, campaign management system content, and device-level control signals are separated and recombined at the display endpoint. We have converged on what we call the Three-Layer Signal Model, derived iteratively from integration failures in early deployments and refined over 40+ projects.
Transaction stream
Controller
Campaign content
Node
Zone renderer
Display
Platform
Layer 1: Transaction Data Rendering
POS transaction events — item scans, price lookups, payment confirmations — arrive as structured data events (typically JSON over a local TCP socket or RS-232 bridge) and must be rendered into the display's transaction zone within 120ms of the triggering event to avoid a perceptible lag between scanner beep and screen update. This requires that the compositor process is running locally on an edge controller, not relying on a cloud round-trip. We use a dedicated rendering thread with real-time priority scheduling, isolated from the campaign content rendering process at the OS scheduler level.
Layer 2: Campaign Content Delivery
Campaign content — promotional media, offer overlays, loyalty program messaging — is pre-positioned to a local SSD cache during off-peak hours via the store's LAN. The compositor selects and plays campaign assets from cache, not from a live stream. This design choice is critical: supermarket in-store networks are notoriously congested during peak trading hours (12:00–14:00 and 17:00–19:00), and a live-stream dependent system will exhibit buffering artifacts at precisely the moments of highest customer exposure.
Layer 3: Device Management and Health Monitoring
Every display unit registers heartbeat telemetry (CPU temperature, memory pressure, display signal lock status, last successful content refresh timestamp) to the central device management platform at 60-second intervals. Threshold breaches trigger automated alerts routed to the store's facilities management system, not to a remote NOC — a deliberate design choice that reduces mean-time-to-remediation because the person who can physically reach the display receives the alert directly.
Content Design Constraints Specific to Checkout Context
Content strategy for checkout stretched displays is a discipline that sits at the intersection of UX, brand communication, and transactional information design. The following principles are derived from customer dwell-time studies and A/B content testing conducted across live store deployments, not from generalized digital signage guidelines.
Measured Business Outcomes: A Cross-Project Summary
The following data is drawn from post-deployment ROI reviews conducted with 9 retail clients 12 months after full system go-live. All figures are retailer-reported and have been range-averaged where individual client confidentiality applies. We present them not as guaranteed outcomes but as a calibration reference for operators building their own business cases.
| METRIC | BASELINE (PRE-DEPLOYMENT) | 12-MONTH POST-DEPLOYMENT | SOURCE METHOD |
|---|---|---|---|
| Promoted item uplift (featured SKUs) | Reference index: 1.00 | 1.14 – 1.22× | Matched store control group / scanner data |
| Loyalty program enrollment at POS | 0.8% of transactions | 2.1 – 2.7% of transactions | CRM enrollment source tagging |
| Checkout lane customer complaints re: price accuracy | 4.2 per 10,000 transactions | 1.1 per 10,000 transactions | Customer service ticket categorization |
| Display hardware support call volume | N/A (legacy static signage) | 0.3 calls per 100 units / month | Facilities management ticket system |
| Average payback period (hardware + integration) | — | 18 – 26 months | Retailer finance team (advertising revenue + operational savings) |
"The reduction in price-dispute complaints is the outcome that surprises retail operations teams most consistently. A high-contrast, real-time item confirmation display eliminates an entire category of customer-staff friction that previously occupied measurable cashier time and drove NPS detractors."
Implementation Risk Factors and Mitigation
Based on project retrospectives across our deployment portfolio, the following risk factors account for the majority of schedule delays and budget overruns in stretched display integration projects. We document them here because they are systematically underweighted in standard project plans produced by teams without direct experience in live retail environments.
| RISK FACTOR | PROBABILITY (OUR PORTFOLIO) | MITIGATION |
|---|---|---|
| POS middleware API undocumented changes | Encountered in 38% of projects | Require frozen API version commitment from POS vendor in scope document; build adapter layer in integration architecture so display compositor is POS-version agnostic. |
| Store network VLAN policy blocking display device registration | Encountered in 51% of projects | Engage store IT network team minimum 8 weeks before go-live. Provide device MAC address list and required port/protocol matrix in advance. Never assume a standard retail VLAN policy. |
| Counter fascia non-standard depth at legacy sites | Encountered in 29% of projects | Physical site survey (not photo survey) of minimum 10% of planned installation sites before hardware procurement. Bespoke mounting brackets add 3–5 weeks lead time if discovered post-procurement. |
| Content management system incompatibility with display zone model | Encountered in 44% of projects | Validate CMS zone-output capability against the specific display aspect ratio during vendor evaluation — not after contract signature. Many retail CMS platforms assume 16:9 as the only output format. |
Recommended Deployment Sequence
The deployment sequence below represents our current recommended project methodology for a first-time stretched display rollout in a multi-site supermarket environment. It is structured to front-load technical risk validation and avoid the common failure pattern of hardware procurement preceding architecture confirmation.